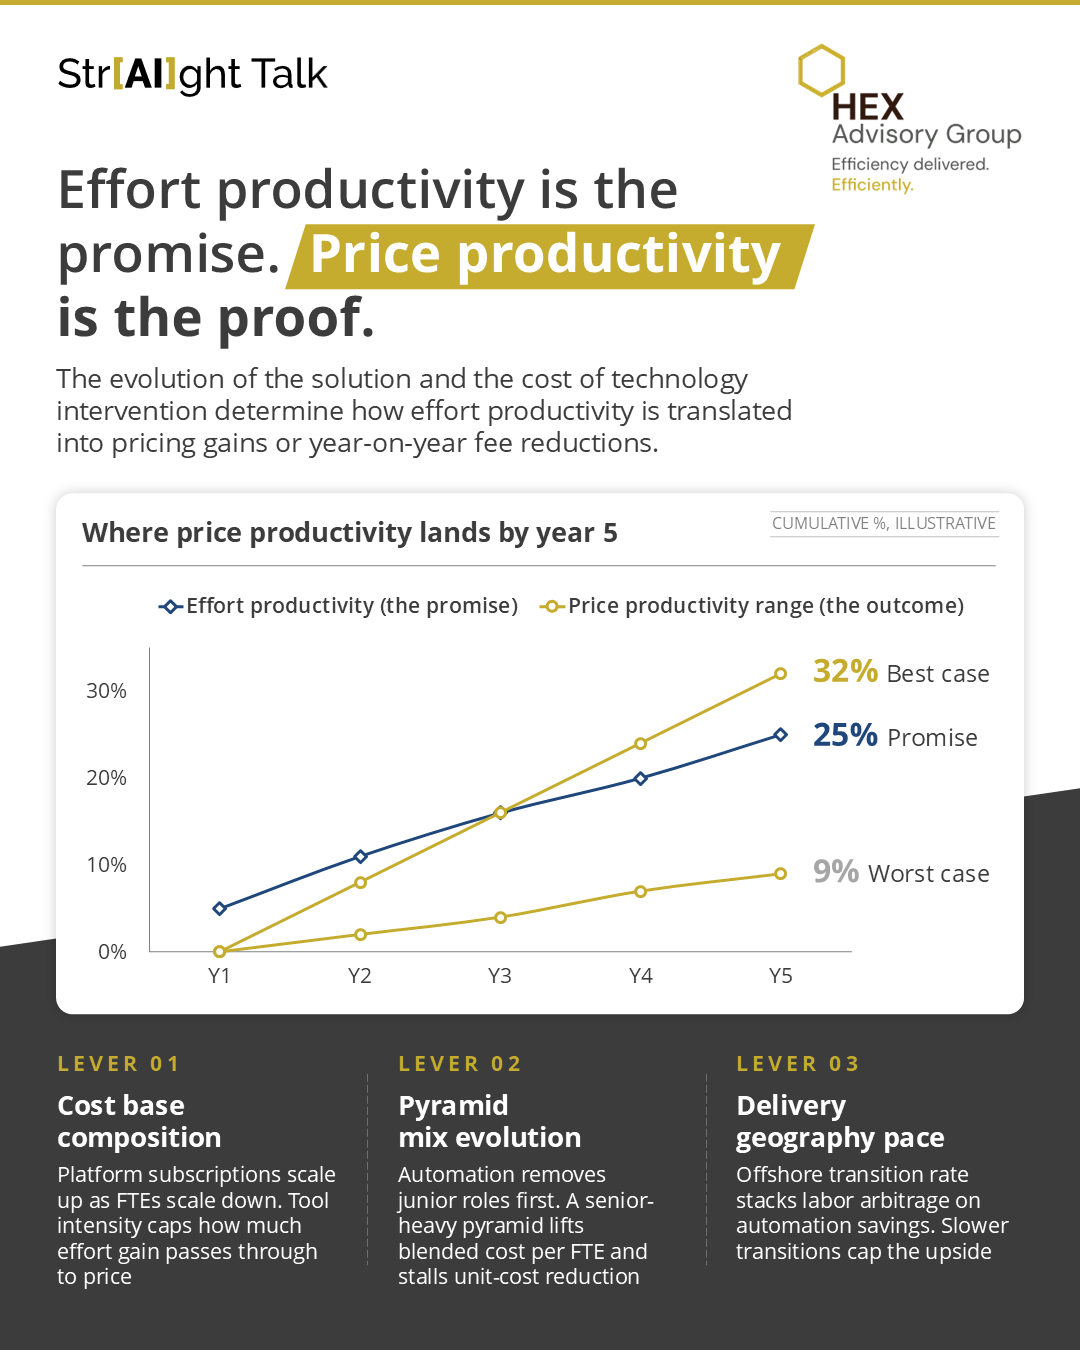
The objective isn’t lower effort. It’s stronger economics.
Technology investments, automation, and delivery decisions create value only when they improve the price curve over time. That’s the difference between operational efficiency and commercial advantage.
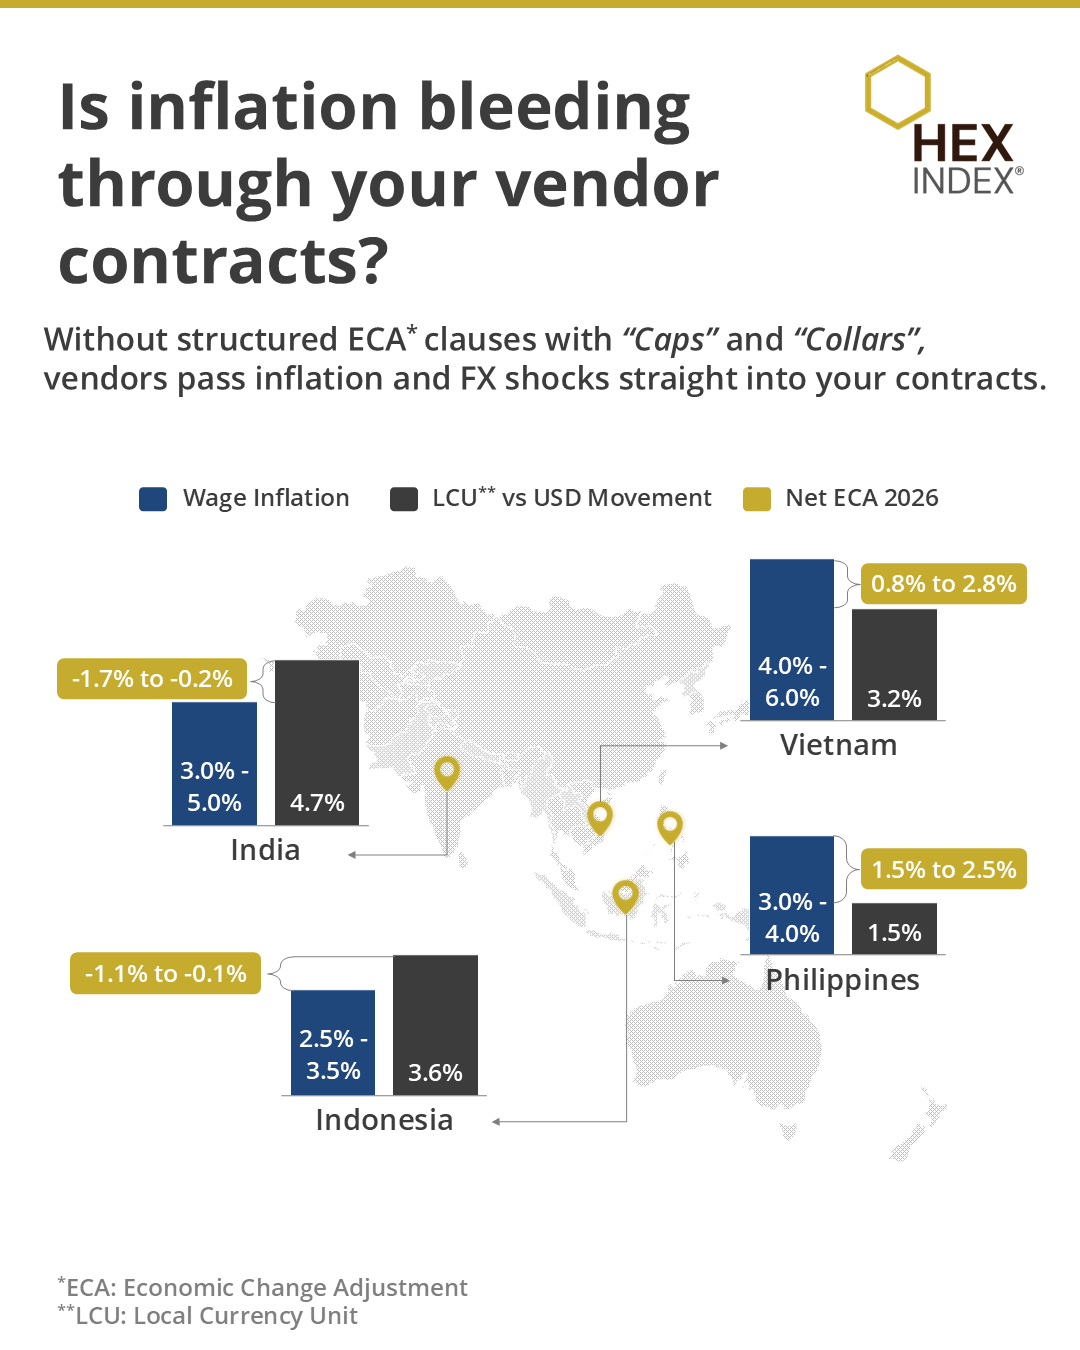
Inflation isn’t just hitting fuel and fares, it’s quietly rewriting your vendor contracts.
If you’re in Travel, Transportation, or Hospitality, those “small” clauses are now cost leak pipelines. FX swings + wage inflation = margin erosion you didn’t approve.
The real question: Are your contracts protecting you or pricing against you?
#HEX Index cuts through the noise with the industry’s only #AI-powered #benchmarking platform, giving you real-time visibility to challenge, renegotiate, and stay ahead of inflation.
Presenting Part 6 of our series — “Executive Cheat Sheet on T&Cs” — your no-fluff guide to Contracting 101. We break down dense terms and conditions into what they actually mean, why they matter, and how they impact your IT and BPO deals.
Presenting Part 4 of our series “Executive Cheat Sheet on T&Cs”, your no-fluff guide to Contracting 101. We break down dense terms and conditions into what they actually mean, why they matter, and how they impact your IT and BPO deals.
Service Providers use financial engineering tools like discounts and credits to make deals lucrative. In many contracts, the service provider and the client contribute an amount towards innovation fund. These funds are utilized to carry out innovation projects that may include automation, digital solutioning, transformation, among others.
Navigating the intricate landscape of Population Health Management (PHM) pricing demands more than just numbers—it requires expertise. With over 60% of healthcare organizations already on the PHM journey and the market set for substantial growth, the stakes are high. Let us be your guide in unraveling the complexities of PHM investments.
Enterprise sensitivity towards disruptive technology, cost, performance, contractual and governance efficiencies is heightened. Pro-incumbency sentiments observed in 2021-22 has reversed and any lagging incumbent is on the chopping block.
To know more click here.
While solution & technology underpinning continues to be a hygiene expectation, enterprises have become much more sensitive to pricing, T&Cs, and governance when choosing their providers.
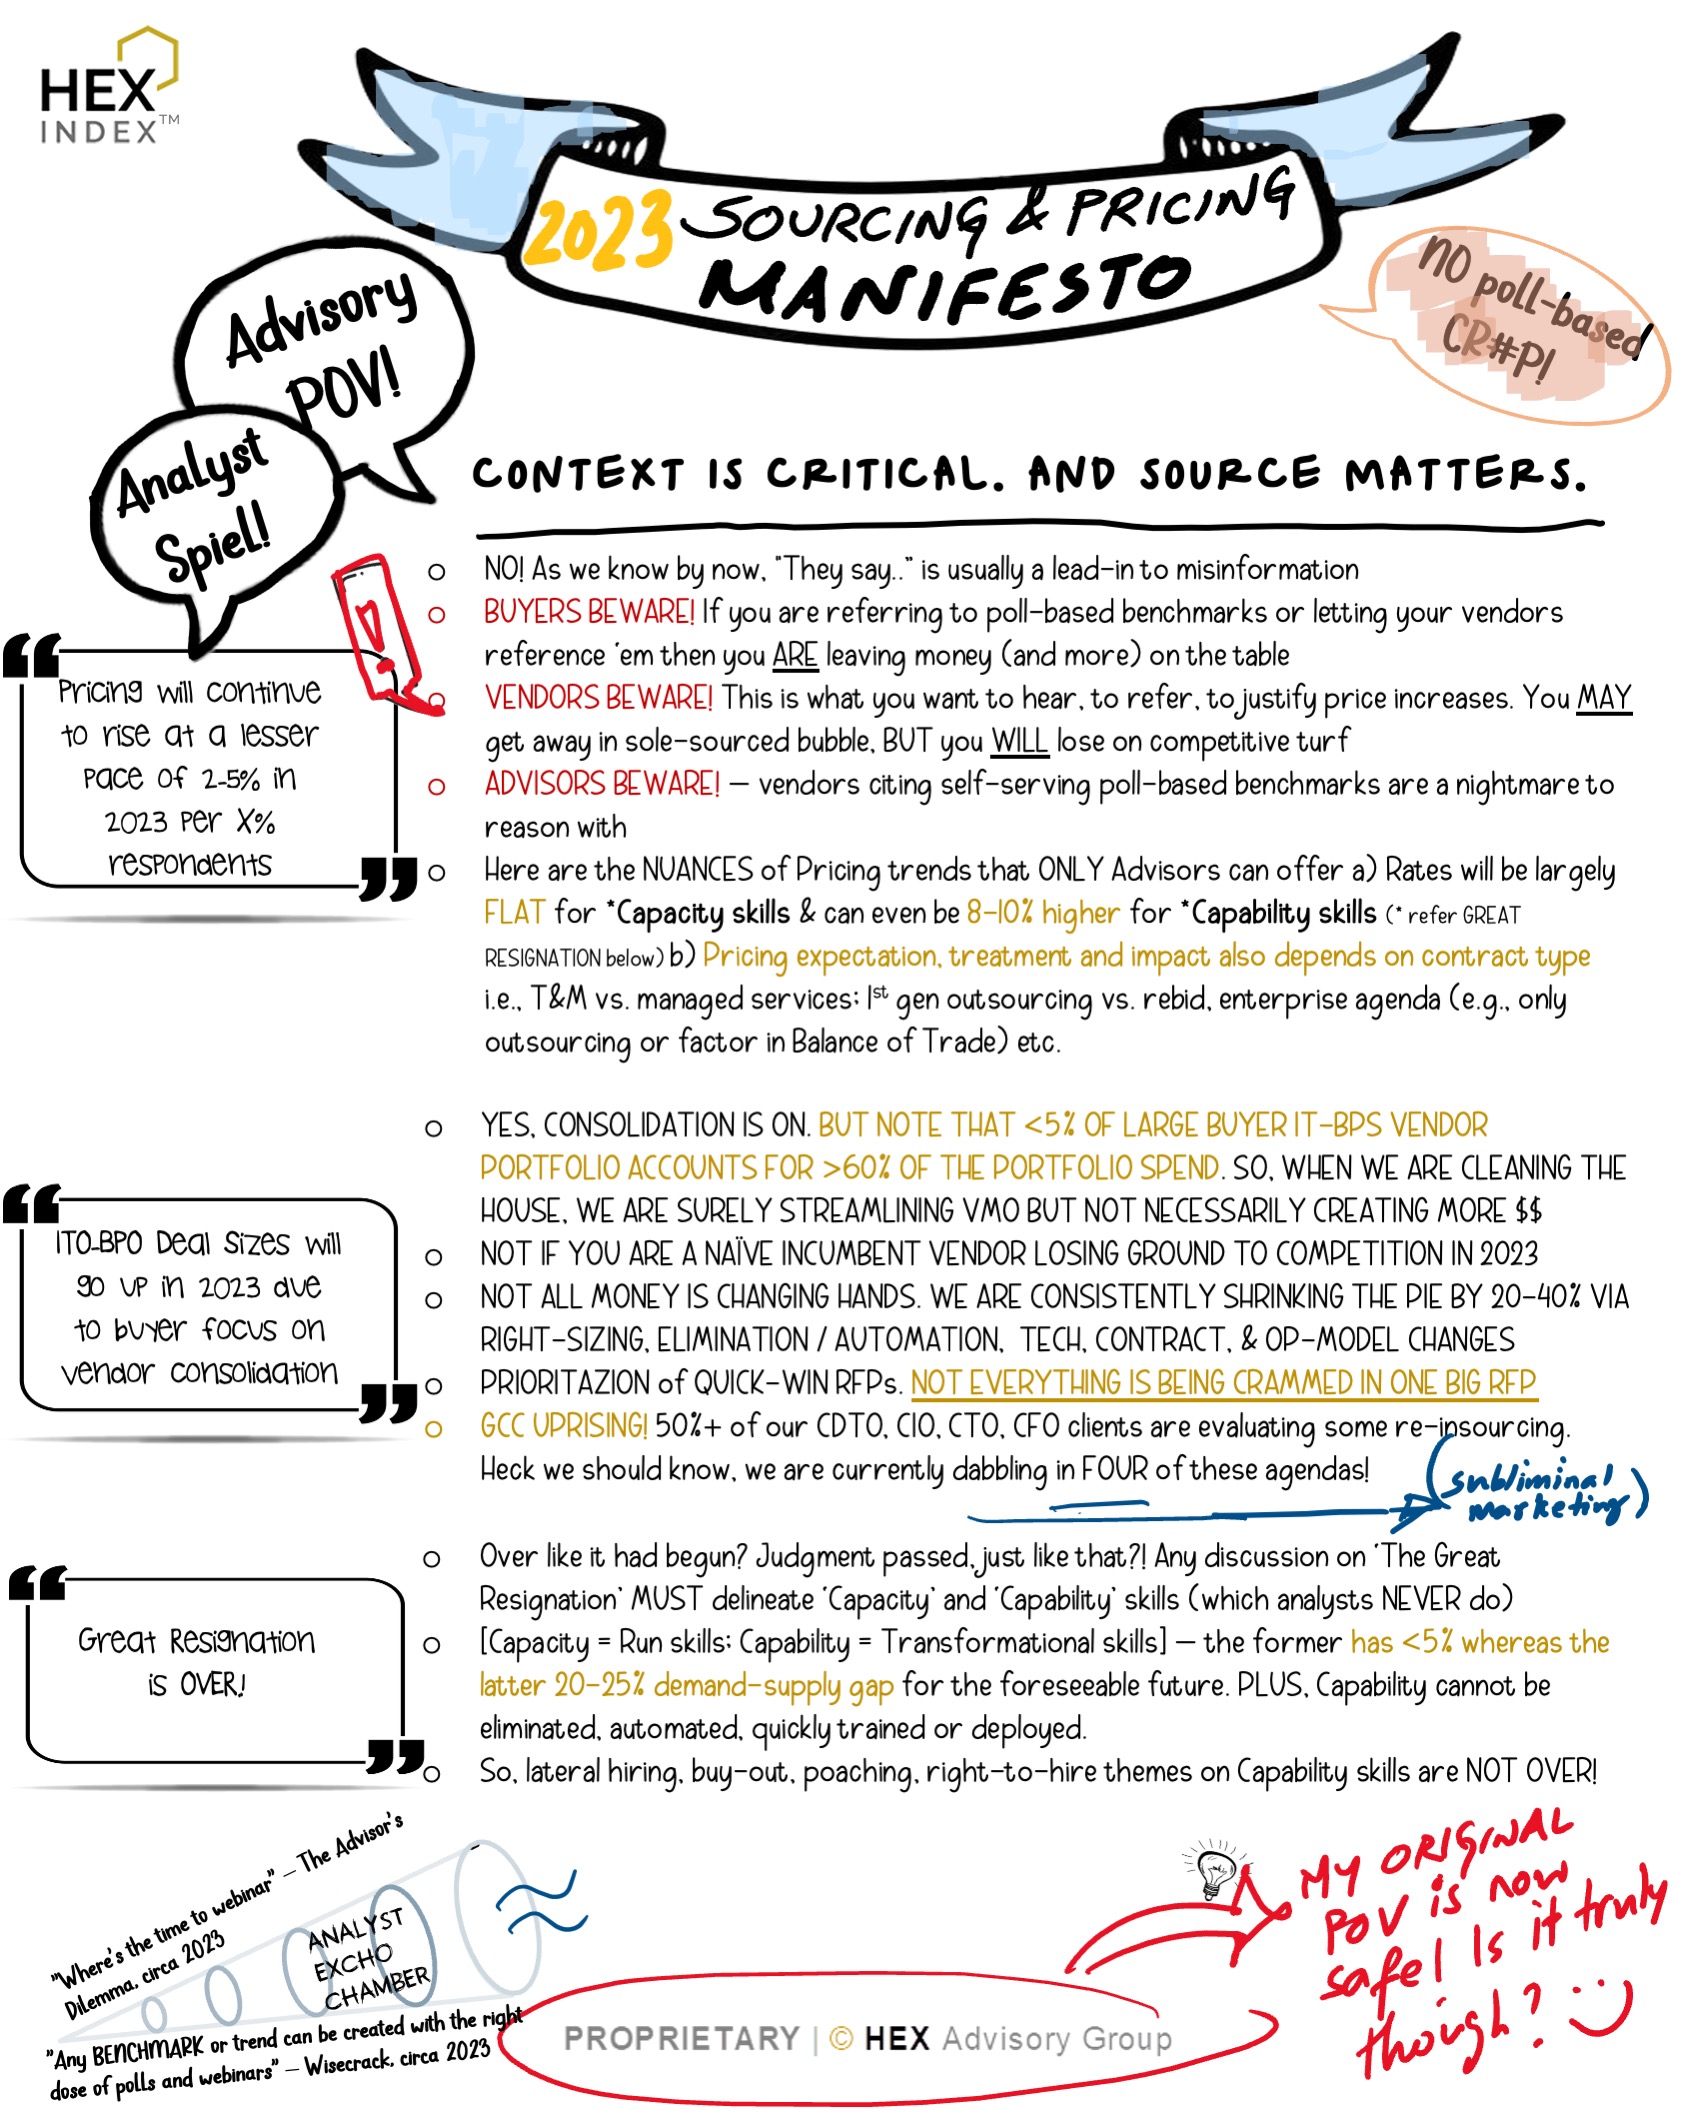
Avoid tacos at 7-Eleven and coffee at Taco Bell. Source matters in everything you consume and that applies to Sourcing and Price Benchmarking trends too.
Don’t ask an advisor what the size of ChatGPT in sourcing deals will be in 2025 and don’t ask a researcher how best to calibrate your multi-million-dollar contracts. You are bound to be misled in either case.
There’s so much broad stroking on IT-BPO Sourcing & Pricing trends going around that I decided not to write a blog post but a MANIFESTO! 🙂
What you control is governed by the metrics you measure and report on. But are the right metrics being measured? Traditionally, the functional and back-office metrics have been linked to the respective functional areas and the linkage to enterprise objectives, if at all, may not be evident. The Business Level Agreements (BLAs) framework can help fill this vacuum and ensure that the reported metrics are linked to the business priorities.
Some of the typical BLAs used in F&A processes:
Accounts Payable: Error free payments, DPO, PO penetration
Accounts Receivable: DSO, Cash Application Time, Average Time to Bill
General Accounting: Days to close month-end, Reconciliation Cycle Time
A well thought out set of BLAs is a great mechanism for the support functions (and service providers) to see their impact on the business and the other way round. Enterprises are increasingly embedding these in the contracts to drive risk-sharing and partnership behaviours.
Contracts with remit ranging from managed services to supporting Digital Transformation need to clearly delineate the solution and the underlying people and commercial construct. The Capacity and Capability charters are very distinct and painting both with the same brush can lead to a less than an Optimum outcome for both parties.
In this hyperinflationary environment, COLA, once a standard provision, is gaining increasing prominence. And rightly so, as a typical managed services contracts spans 5 years and a robust COLA mechanism/clause that protects the interests of both parties is critical to an equitable contract. It is also in the interest of both Buyer and Seller to include a Benchmarking clause that allows potential commercial ‘reset’ in an uncertain business environment.
Field Service productivity is impacted by SLAs and the underlying support model. The primary driver for productivity is strong emphasis on ticket elimination and “shift-left” of the issues. Productivity can be increased by reducing field service engineers’ intervention. In order to achieve this, service providers can consider strengthening the L1/L1.5 Support with tenured resources to maximize resolution at that level. Furthermore, providers can also consider leveraging following mechanisms to enhance efficiency:
Leveraging Inter vPro or similar solutions for remote troubleshooting
Typically, first gen outsourcing deals / legacy environments have calls and emails as predominant contact channel and proportion of calls and emails could potentially exceed 80-90% of the contacts. However, as service providers rationalize the workflow and implement chat bot and other tools, proportion of calls and emails gets reduced in favour of other channels e.g., chat and web with lower cost to serve. In an end state, service providers may have 60-75% of contact volume by web and chat and remaining 25%-40% by phone calls and emails.
Our advice to enterprises and service providers is to leverage/ contextualize the benchmarks depending upon scope of services and not to have pre-emptive bias for or against any industry. Simply speaking, if scope is a horizontal such as a multi-tower infrastructure deal with its own baselines and environment maturity, then that should drive the benchmark reference set agnostic of industry. However, if we are talking about industry specific scope e.g., payer platform or trading platform support, we’ll need to consider industry specific benchmarks.
Productivity gains and automation impact over the deal term is driven by environmental maturity.. To assess the potential productivity gains, a detailed analysis of number and nature of issues in the current environment is required. We would typically expect overall productivity gains as well as speed of realizing productivity gains to be higher in a legacy (1st time outsourcing) environment v/s 2nd/ 3rd Generation outsourcing deals.
In managed services contracts, we continue to draft up and get equitable agreement for a 3.0%-3.5%global COLA i.e., applicable to the managed services delivery model incl. the underlying global delivery location portfolio agreed by both parties. The expectation is that the above 3.0-3.5% should be explicitly stated as part of the fee assumptions but needs to be pre-baked into the Y1-Y5 ACV’s i.e., no fee changes during the initial contract term. This incentivizes / encourages the provider to offset COLA against automation-led benefits in the out years, staffing mix and on-offshore mix changes during the contract term etc.
Besides the managed services component, there is typically the project rate card i.e., T&M component in the pricing exhibits. Typically, COLA is applied starting Y3 of the deal & can have higher exposure than managed services COLA i.e., in the 3-5% range depending on skill sets. COLA is subject to the benchmarking clause i.e., if either party wishes to invoke the benchmarking clause to sense-check any significant rate/market changes if the contracted COLA is unacceptable by either party when the need arises
All providers are concerned about the wage inflation, which while real for experienced/lateral hires, needs to be contextualized in the scope of a typical IT-BPS managed services delivery solution. Fact is that the entry-level salaries have remained consistent for the last many years and the same is true even now. Plus, all providers are pushing their entry-level pool to Tier2/3/4 locations and colleges to keep this entry-level cost base consistent, and this is where most providers expect to build 70-80% of their incremental seat capacity esp. with the remote model – most providers have alluded to this in recent quarterly earnings strategies as a margin retention measure. In addition, in a typical delivery AO/IO/BPO pyramid, 75%-80% of the resources are in these bottom two rungs wherein the compensation is being held steady. So, the talent war and the heated 20%-40% wage hikes for experienced hires only applies to 20%-25% of the wage pyramid i.e., 4%-10% net wage increase on a blended wage pyramid. However, wage / compensation is ~50% of a fully loaded offshore rate card (other components being real-estate, telecom/technology, consumables, SG&A, op-margins), therefore, the net offshore rate card impact of blended wage increase is halved to 2%-5%. Now, offshore is typically 80%-90% of the offshore-onshore managed services delivery. Therefore, the net service delivery impact of COLA in a global managed services contract is 2.5%-4.5% and with this rationale we manage to close the agreement at 3.0-3.5% global COLA on equitable and transparent footing.
The objective isn’t lower effort. It’s stronger economics.
Technology investments, automation, and delivery decisions create value only when they improve the price curve over time. That’s the difference between operational efficiency and commercial advantage.
Inflation isn’t just hitting fuel and fares, it’s quietly rewriting your vendor contracts.
If you’re in Travel, Transportation, or Hospitality, those “small” clauses are now cost leak pipelines. FX swings + wage inflation = margin erosion you didn’t approve.
The real question: Are your contracts protecting you or pricing against you?
#HEX Index cuts through the noise with the industry’s only #AI-powered #benchmarking platform, giving you real-time visibility to challenge, renegotiate, and stay ahead of inflation.
Presenting Part 6 of our series — “Executive Cheat Sheet on T&Cs” — your no-fluff guide to Contracting 101. We break down dense terms and conditions into what they actually mean, why they matter, and how they impact your IT and BPO deals.
Presenting Part 4 of our series “Executive Cheat Sheet on T&Cs”, your no-fluff guide to Contracting 101. We break down dense terms and conditions into what they actually mean, why they matter, and how they impact your IT and BPO deals.
Service Providers use financial engineering tools like discounts and credits to make deals lucrative. In many contracts, the service provider and the client contribute an amount towards innovation fund. These funds are utilized to carry out innovation projects that may include automation, digital solutioning, transformation, among others.
Navigating the intricate landscape of Population Health Management (PHM) pricing demands more than just numbers—it requires expertise. With over 60% of healthcare organizations already on the PHM journey and the market set for substantial growth, the stakes are high. Let us be your guide in unraveling the complexities of PHM investments.
Enterprise sensitivity towards disruptive technology, cost, performance, contractual and governance efficiencies is heightened. Pro-incumbency sentiments observed in 2021-22 has reversed and any lagging incumbent is on the chopping block.
To know more click here.
While solution & technology underpinning continues to be a hygiene expectation, enterprises have become much more sensitive to pricing, T&Cs, and governance when choosing their providers.
Avoid tacos at 7-Eleven and coffee at Taco Bell. Source matters in everything you consume and that applies to Sourcing and Price Benchmarking trends too.
Don’t ask an advisor what the size of ChatGPT in sourcing deals will be in 2025 and don’t ask a researcher how best to calibrate your multi-million-dollar contracts. You are bound to be misled in either case.
There’s so much broad stroking on IT-BPO Sourcing & Pricing trends going around that I decided not to write a blog post but a MANIFESTO! 🙂
What you control is governed by the metrics you measure and report on. But are the right metrics being measured? Traditionally, the functional and back-office metrics have been linked to the respective functional areas and the linkage to enterprise objectives, if at all, may not be evident. The Business Level Agreements (BLAs) framework can help fill this vacuum and ensure that the reported metrics are linked to the business priorities.
Some of the typical BLAs used in F&A processes:
Accounts Payable: Error free payments, DPO, PO penetration
Accounts Receivable: DSO, Cash Application Time, Average Time to Bill
General Accounting: Days to close month-end, Reconciliation Cycle Time
A well thought out set of BLAs is a great mechanism for the support functions (and service providers) to see their impact on the business and the other way round. Enterprises are increasingly embedding these in the contracts to drive risk-sharing and partnership behaviours.
HEX Advisory Group is an independent IT and BPS sourcing advisory and benchmarking firm headquartered in the United States. Founded in 2022 by former leaders of the benchmarking and sourcing practices at Everest Group, WGroup, and Wavestone, HEX provides contract health checks, outsourcing cost optimization, benchmark-led negotiations, and GCC advisory to global enterprises and private equity firms. Our proprietary HEX Index® platform delivers rate and pricing benchmarks derived exclusively from real outsourcing contracts across 50+ global locations.